How to use the STAT button on a TI-84 calculator
- Nathan Laughton

- Feb 3, 2022
- 4 min read
Updated: Jul 14
Take a look below to learn everything you need to know about the STAT button on your calculator: how to find trend-lines of all kinds; how to find the mean, median, standard deviation, and interquartile range of a data set; how to use frequency tables; how to graph scatter plots, histograms, box-and-whisker plots; and more. Plus troubleshooting tips for some of the most common problems, like lists disappearing or the R² value not displaying for regression models.
Where is the STAT button on a TI-84 calculator?
It's right here!

Find a linear regression or trend-line
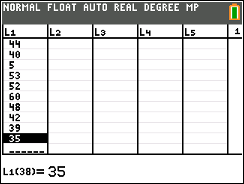
Press [STAT] [ENTER] to input your x-values into L1 and your y-values into L2

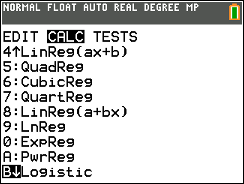
Then press [STAT] [›] to open the CALC menu, then press [4] for LinReg

If they're not already there, enter L₁ and L₂ under XList and Ylist by pressing [2nd ] [1] and [2nd] [2]

Then, if you'd like to graph the trend-line too, scroll down to Store RegEQ, then press [ALPHA] [TRACE] [ENTER]

Lastly, scroll down to Calculate and press [ENTER]

Find a quadratic, cubic, quartic, logarithmic , exponential, or logistic regression
Follow the steps above for a linear regression, but select [5] QuadReg for a quadratic regression, [6] CubicReg for a cubic regression, [7] QuartReg for a quartic regression, [9] LnReg for a logarithmic regression, [0] ExpReg for an exponential regression, or [B] Logistic for a logistic regression. Everything else stays the same.
Graph a scatter plot
Press [STAT] [ENTER] then input your data into L₁ and L₂. If you want, follow the steps above to run a regression.

Then press [y =] and scroll up to Plot1 and hit [Enter] to turn it on.

Lastly press [ZOOM] [9] to select ZoomStat and graph.


If you're having trouble, try pressing [2nd] [y=] to open the STAT PLOTS menu, then press [ENTER]

Make sure your settings match the picture below, specifically the Type, XList, and Ylist

Turn on R² value (correlation coefficient) for linear regression
Press [2nd] [0] to bring up the Catalogue, then press [x⁻¹] to jump to the D's. Scroll down to DiagnosticOn and press [ENTER] twice.

Find 5 number summary (max, min, median, first quartile, third quartile), mean (average), and standard deviation of a list
Press [STAT] [ENTER] then input your data into L₁

Then press [STAT] [›] to open the CALC menu, then press [ENTER] for 1-Var Stats

Scroll down a little to find the minimum (minX), first quartile (Q1), median (Med), third quartile (Q3) and maximum (maxX). You'll also find the average (x̄), sum (Σx), standard deviation of the sample (Sx), standard deviation of the population (σx) and number of items (n).

Input a frequency table
Press [STAT] [ENTER]. Input your values into L₁ and their frequency into L₂
Follow the instructions above for finding a 5-number summary, but when you get to the 1-Var Stats page, add L₂ under FreqList by pressing [2nd] [2]

Draw a box and whisker plot
Press [STAT] [ENTER] then input your data into L₁
Then press [2nd] [y=] to open the Stat Plots menu. I recommend different plot than before, so press [2] to select Plot 2 and then [ENTER] to turn it on.

Then for Type, scroll right four times and hit [ENTER] to select the box-and-whisker plot (second from the right). Then make sure XList says L₁

Lastly, hit [ZOOM] [9] to select ZoomStat and graph.

You can turn plots off any time by returning to the STAT PLOTS menu or pressing [y=] and deselecting the Plot at the top of the screen.
Draw a histogram
Press [STAT] [ENTER] then input your data into L₁
Then press [2nd] [y=] to open the Stat Plots menu. I recommend different plot than before, so press [3] to select Plot 3 and then [ENTER] to turn it on.

Then for Type, scroll right twice and hit [ENTER] to select the histogram plot (third from the left). Then make sure XList says L₁

Lastly, hit [ZOOM] [9] to select ZoomStat and graph.

You can turn plots off any time by returning to the STAT PLOTS menu or pressing [y=] and deselecting the Plot at the top of the screen.
Restore missing lists (L1, L2...) under STAT > Edit
Press [STAT] [5] [ENTER] to run the SetupEditor.

Clear a list
Press [STAT] [ENTER]. Use the navigation arrows to select the list at the top that you want to delete (L1, L2...) then press [clear]
More TI-84 Statistics Help Coming Soon
We’ll continue adding calculator guides for the statistics tools students use most often, from regressions and residuals to normal distributions, probability, and AP Statistics topics, on both the TI-84 and Desmos.
A quick reminder: the STAT menu is powerful, but it is not a substitute for understanding what the numbers mean. Finding a standard deviation, regression equation, or five-number summary is only useful if you know how to interpret it in context.
Need Help Making Sense of the Statistics?
The TI-84 can calculate a lot very quickly, but statistics is about more than button-pressing. Students need to understand what the calculator output means, when a model is appropriate, and how to explain their answers clearly.
At Freudigman & Billings, we help students build both the calculator skills and the statistical reasoning behind them — whether they are working through a math class, AP Statistics, science data, or standardized test prep.
For more support, explore our Academic Instruction and Standardized Test Prep programs, or contact us to start a conversation.


So I am trying to make 2 different lines, one with L1 and L2, and one with L1 and L3. My calculator doesn't have the option to change L2 to L3 when trying to find the slope intercept form. What do I do?
(Side note, this article looks like instructions for a TI-84 Plus CE, which is just color edition, and I have the TI-84 Plus, which could make a difference, but IDK)